Chapter 12 Exercise 5 - Accuracy varying with covariate
12.1 Questions
Open up the R project for Exercise 5 (i.e., the R project file named Exercise 5.Rproj).
In the Exercise 5 folder, you will find partially completed R scripts. To answer the questions, try to complete the missing parts (they are highlighted by a #TO COMPLETE# comment). We also provided complete R scripts, but try to work it out on your own first!
Some anecdotic reports suggest that expression of PAG may vary as function of number of days of pregnancy. We could, therefore, hypothesize that PAG’s Se and Sp may vary if the test is conducted early (≤ 35 days post-breeding) compared to later (>35 days post-breeding). When cross-tabulating the studies results for the PAG and US tests as function of days since breeding, we get:
Table. Cross-classified results from a PAG and US test as function of number of days since breeding.
| ≤ 35 days | >35 days | |||||
|---|---|---|---|---|---|---|
| US+ | US- | US+ | US- | |||
| PAG+ | 143 | 11 | PAG+ | 112 | 10 | |
| PAG- | 2 | 136 | PAG- | 0 | 82 |
1.Start from the partially completed Question 1.R script located in Exercise 5 folder. Build a model for two diagnostic tests, one single population, but with Se and Sp of the PAG test varying as function of days since breeding. Use the Romano et al. (2006) results, to inform the priors for the Se and Sp of a US exam (Se: 0.90, 95CI: 0.85, 0.95; Sp: 0.95, 95CI: 0.90, 0.97). Assume conditional independence between tests. How many degrees of freedom do you have and how many unknown parameters do you need to estimate? Based on your results, would you conclude that PAG accuracy is influenced by number of days since breeding?
12.2 Answers
1. How many degrees of freedom do you have and how many unknown parameters do you need to estimate? Based on your results, would you conclude that PAG accuracy is influenced by number of days since breeding?
Answer: We have 6 degrees of freedom and 8 unknown parameters to estimate (one Se and one Sp for US, 2 Se and 2 Sp for PAG, and two prevalence). We need two informative priors to make the LCM identifiable.
The results from this LCM are below.
Table. Results for the LCM allowing for varying accuracy of PAG as function of days since breeding.
| Parameter | Median | 95CI |
|---|---|---|
| Prevalence 28-35 days | 0.521 | 0.462, 0.580 |
| Prevalence 36-45 days | 0.584 | 0.512, 0.653 |
| Se US | 0.928 | 0.895, 0.956 |
| Sp US | 0.977 | 0.957, 0.990 |
| Se PAG 28-35 days | 0.991 | 0.963, 1.00 |
| Se PAG 36-45 days | 0.994 | 0.966, 1.00 |
| Sp PAG 28-35 days | 0.980 | 0.927, 0.999 |
| Sp PAG 36-45 days | 0.962 | 0.879, 0.998 |
There was little difference between the 28-35 days since breeding vs. 36-45 days since breeding accuracy parameters. Below, we have plotted the two PAG Sp posterior distributions to illustrate how similar they are. However, since we are not in a Frequentist framework, “testing” whether the 28-35 days vs. 36-45 days accuracy parameters are statistically different is not straightforward. Note that Bayesian methods can be used to compute the probability that a given parameter is larger (or smaller) than another parameter, or than an estimate previously reported in the literature (see Arango-Sabogal et al., 2021 for an applied example.
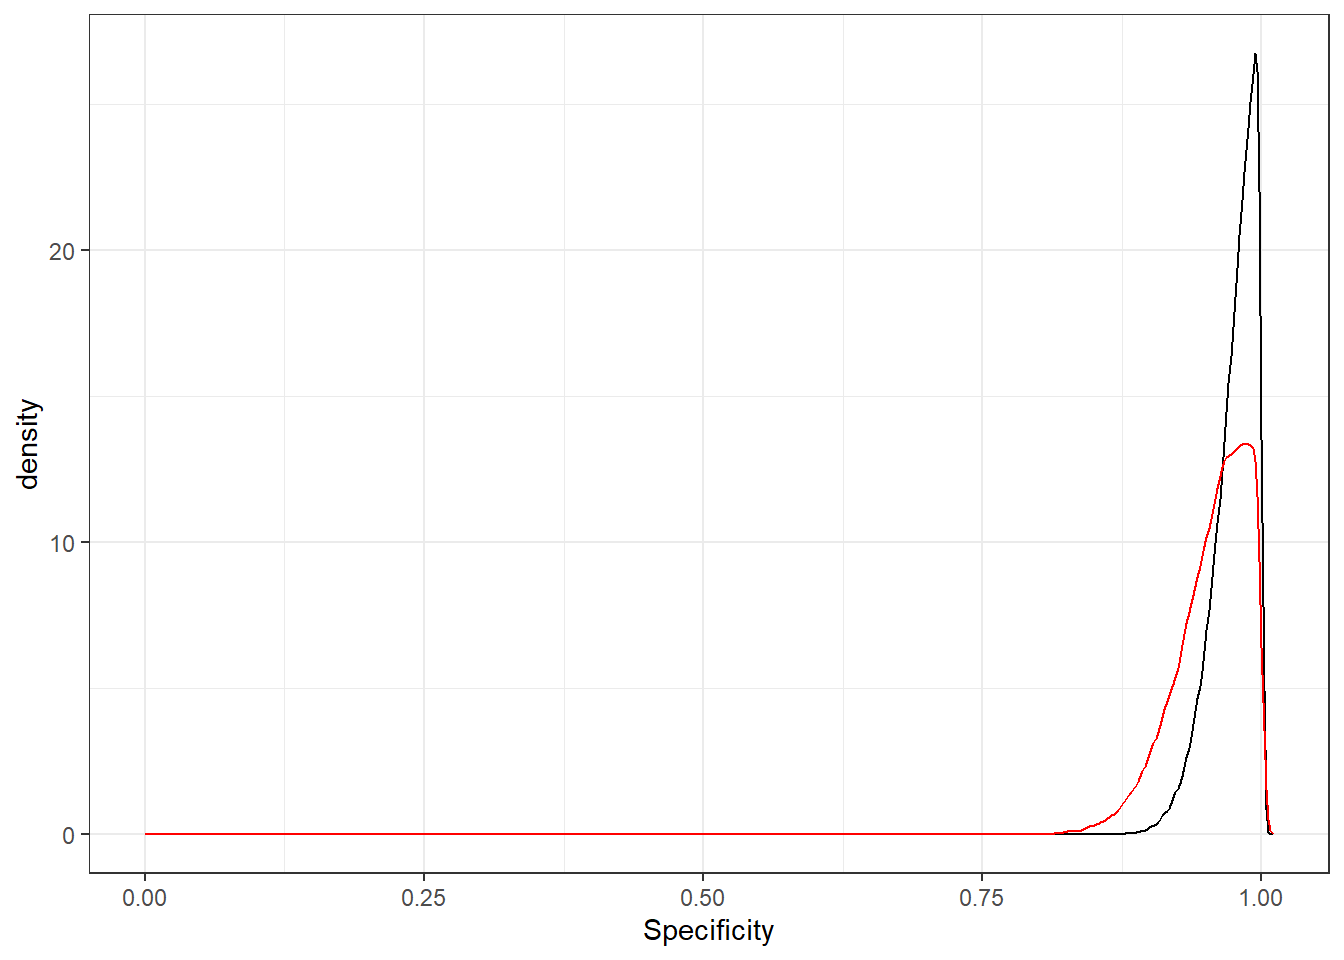
Figure 12.1: Posterior distributions for PAG specificity at 28-35 days (black) and 36-45 days (red) post-breeding.